
About Tesseral

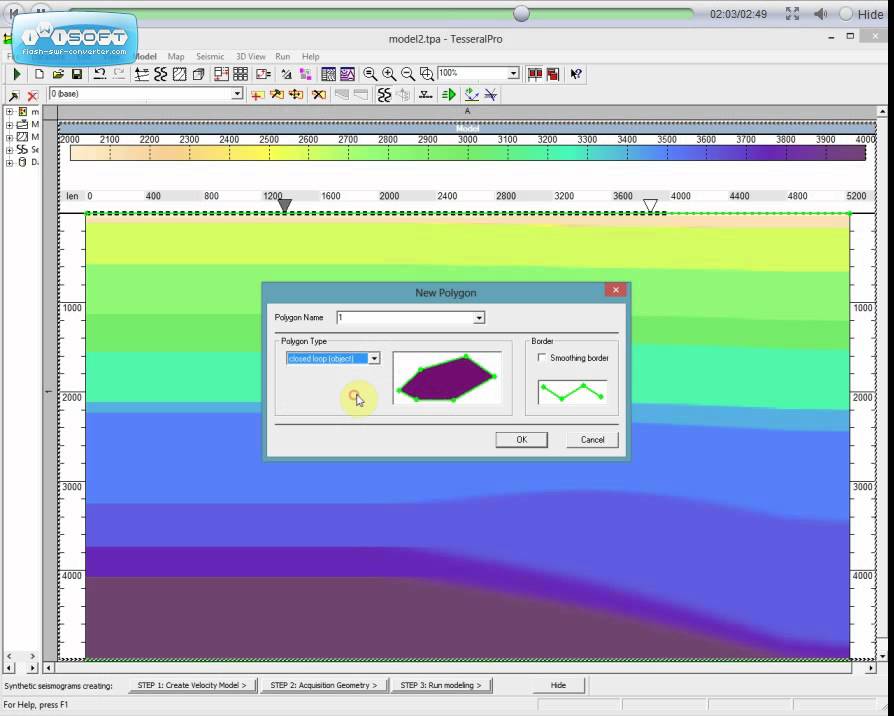
Tesseral software are used for simple processing and imaging analysis. Tesseral possess full wave seismic modeling capabilities and among the most accurate numerical simulation software available. The software need higher computer specification. Full wave modeling has the advantage as reflected discontinuities and structural elements can be image correctly while at the same time preserve resolution capability of the observation system. Aim of this project assignment is to consequently understand the concept of model building, wave propagation, velocity and migration.

Tesseral 2D

From full-wave modeling of complex structures to pre-stack depth migration

Application allows assigning different seismic acquisition geometries, numerical model building of complex seismic sections and modeling propagation of seismic waves in heterogeneous medium for the scalar, acoustic, elastic and elastic anisotropic wave equations.


Algorithms use fast and accurate computational schemebased on the finite difference method, which allows effective modeling of arbitrarily complex geological medium, including the combination of solid and liquid state bodies.


Obtained wave fields can be processed, directly within the software, to obtain seismic images with the help of different modifications of the time and depth migration.

Image result for tesseral software

The software package Tesseral 2D is intended for the interactive analysis and examination of depth-velocity models and it easy fits into the survey planning, processing and interpretation of seismic data.


It is widely used as an educational tool in the study of wavefield propagation phenomena, survey planning, processing and interpretation of seismic data.


Tesseral Pro

Full wave modeling & ray-tracing for oil and gas fields


Tesseral Pro is a new software implementation based on the Tesseral 2D package. It includes additional tools such as ray tracing and it is intended to be used for the interactive analysis and examination of depth-velocity models of oil and gas fields by using geological - geophysical data bases.

The software allows creating depth velocity models from well log data, maps of geological surfaces, 2D and 3D seismic velocity models, for the calculation of synthetic data from 2D built models and as well as the preparation of the 2.5D calculation assignment.

Tesseral Pro enables the creation of thin-layered models capable of high precision and modeling feasibility. Along with well log data, the user can enter additional data such as: well's coordinates and inclinometry, stratigraphic arrangements, fault information, horizon maps etc.

Comments

Popular posts from this blog

Module 3: Pre-Stack and Post-Stack Migration

MODULE 3: WORKFLOW MODULE 3: RESULTS & DISCUSSION Generally, migration consists of pre-stack migration and post-stack migration. Post-stack migration involves the process of correcting normal moveout and dip-moveout on a number of traces, then summing the traces together into a single trace before performing the migration. By using this method, a data volume can be migrated in short time interval and inexpensively. This migration-after-stack procedure has proven over the years to be very successful, especially for imaging the areas with moderate structural complexity. However, for the areas with significant lateral velocity variation such as salt dome structure, we need to do migration before stack. This is due to enormous velocity variations make the post-stack preservation of subsalt reflection events almost impossible. Pre-stack migration, in time or depth, also represents the current commonly applied state of the art. However, this kind of migration is time consuming co...

Module 1: Build a Subsurface Model

MODULE 1: WORKFLOW MODULE 1: RESULTS & DISCUSSION Figure 1 shows the constructed model with acquisition geometry of one source (center) and receivers of 20m interval while Figure 2 shows the constructed model with acquisition geometry of one source (center) and receivers of 50m interval. The decrease in receiver’s interval causes more receivers to be used, hence increase in cost of acquisition. The maximum offset which is the distance between the actual shot and the farthest receiver for both acquisition is 1200m. By using these geometry, the receivers only record seismic events at the depth less than or equal to 1200m. In order to record the seismic events occurred on geological structure at the deeper depth, the maximum offset should be greater than the depth of the geological target. Figure 1: One source (center) and receivers of 20m interval. Figure 2: One source (center) with receivers of 50m interval. Figure 3 shows the model with acquisition ge...

Module 2: Wave Generator and Seismic Modelling

MODULE 2: WORKFLOW MODULE 2: RESULTS & DISCUSSION In acoustic modelling, the model reflects the acoustic impedance properties of layered rock. The acoustic impedance of rock can be obtained by multiplying the compressional wave velocity of the rock and its density. The nature of the compressional wave, P-wave is controlled by a parameter which known as bulk modulus and this modulus deals with the volume change of the medium as the wave travel through it. The impedance contrast at the geological interface determines how much the energy is reflected and transmitted through the layers. The greater the impedance contrast, the greater the wave energy that will be reflected. As shown in Figure 6, the bright colour of amplitude at the top of part of model are due to high acoustic impedance contrast between the layers. The diffraction tail and apex of the diffractions was also observed which might represent the boundary between the salt body and the strata. Furthermore, the wav...